Hiking Trails Map
How it was built, section by section
An interactive map for discovering hiking trails and huts across New Zealand, built on data from the DOC public API. The frontend runs on React and Mapbox GL JS with 3D terrain, custom styling, and a few experimental layers. The backend is Express with MongoDB and Redis caching.
1. Backend
19/07/2025Express server with MongoDB for user data, plus controllers that pull tracks, huts, and alerts from the DOC API. Added Redis caching with a 6-hour TTL, which brought repeated requests down from around 8 seconds to a few milliseconds.
2. Frontend
20/07/2025React 19 with Vite, TypeScript, and Tailwind. Got API calls wired up to fetch data from both MongoDB and the DOC API, then dropped in a map to start testing things visually. All state lives in App.tsx with prop drilling, no state library needed so far.
3. Custom Markers
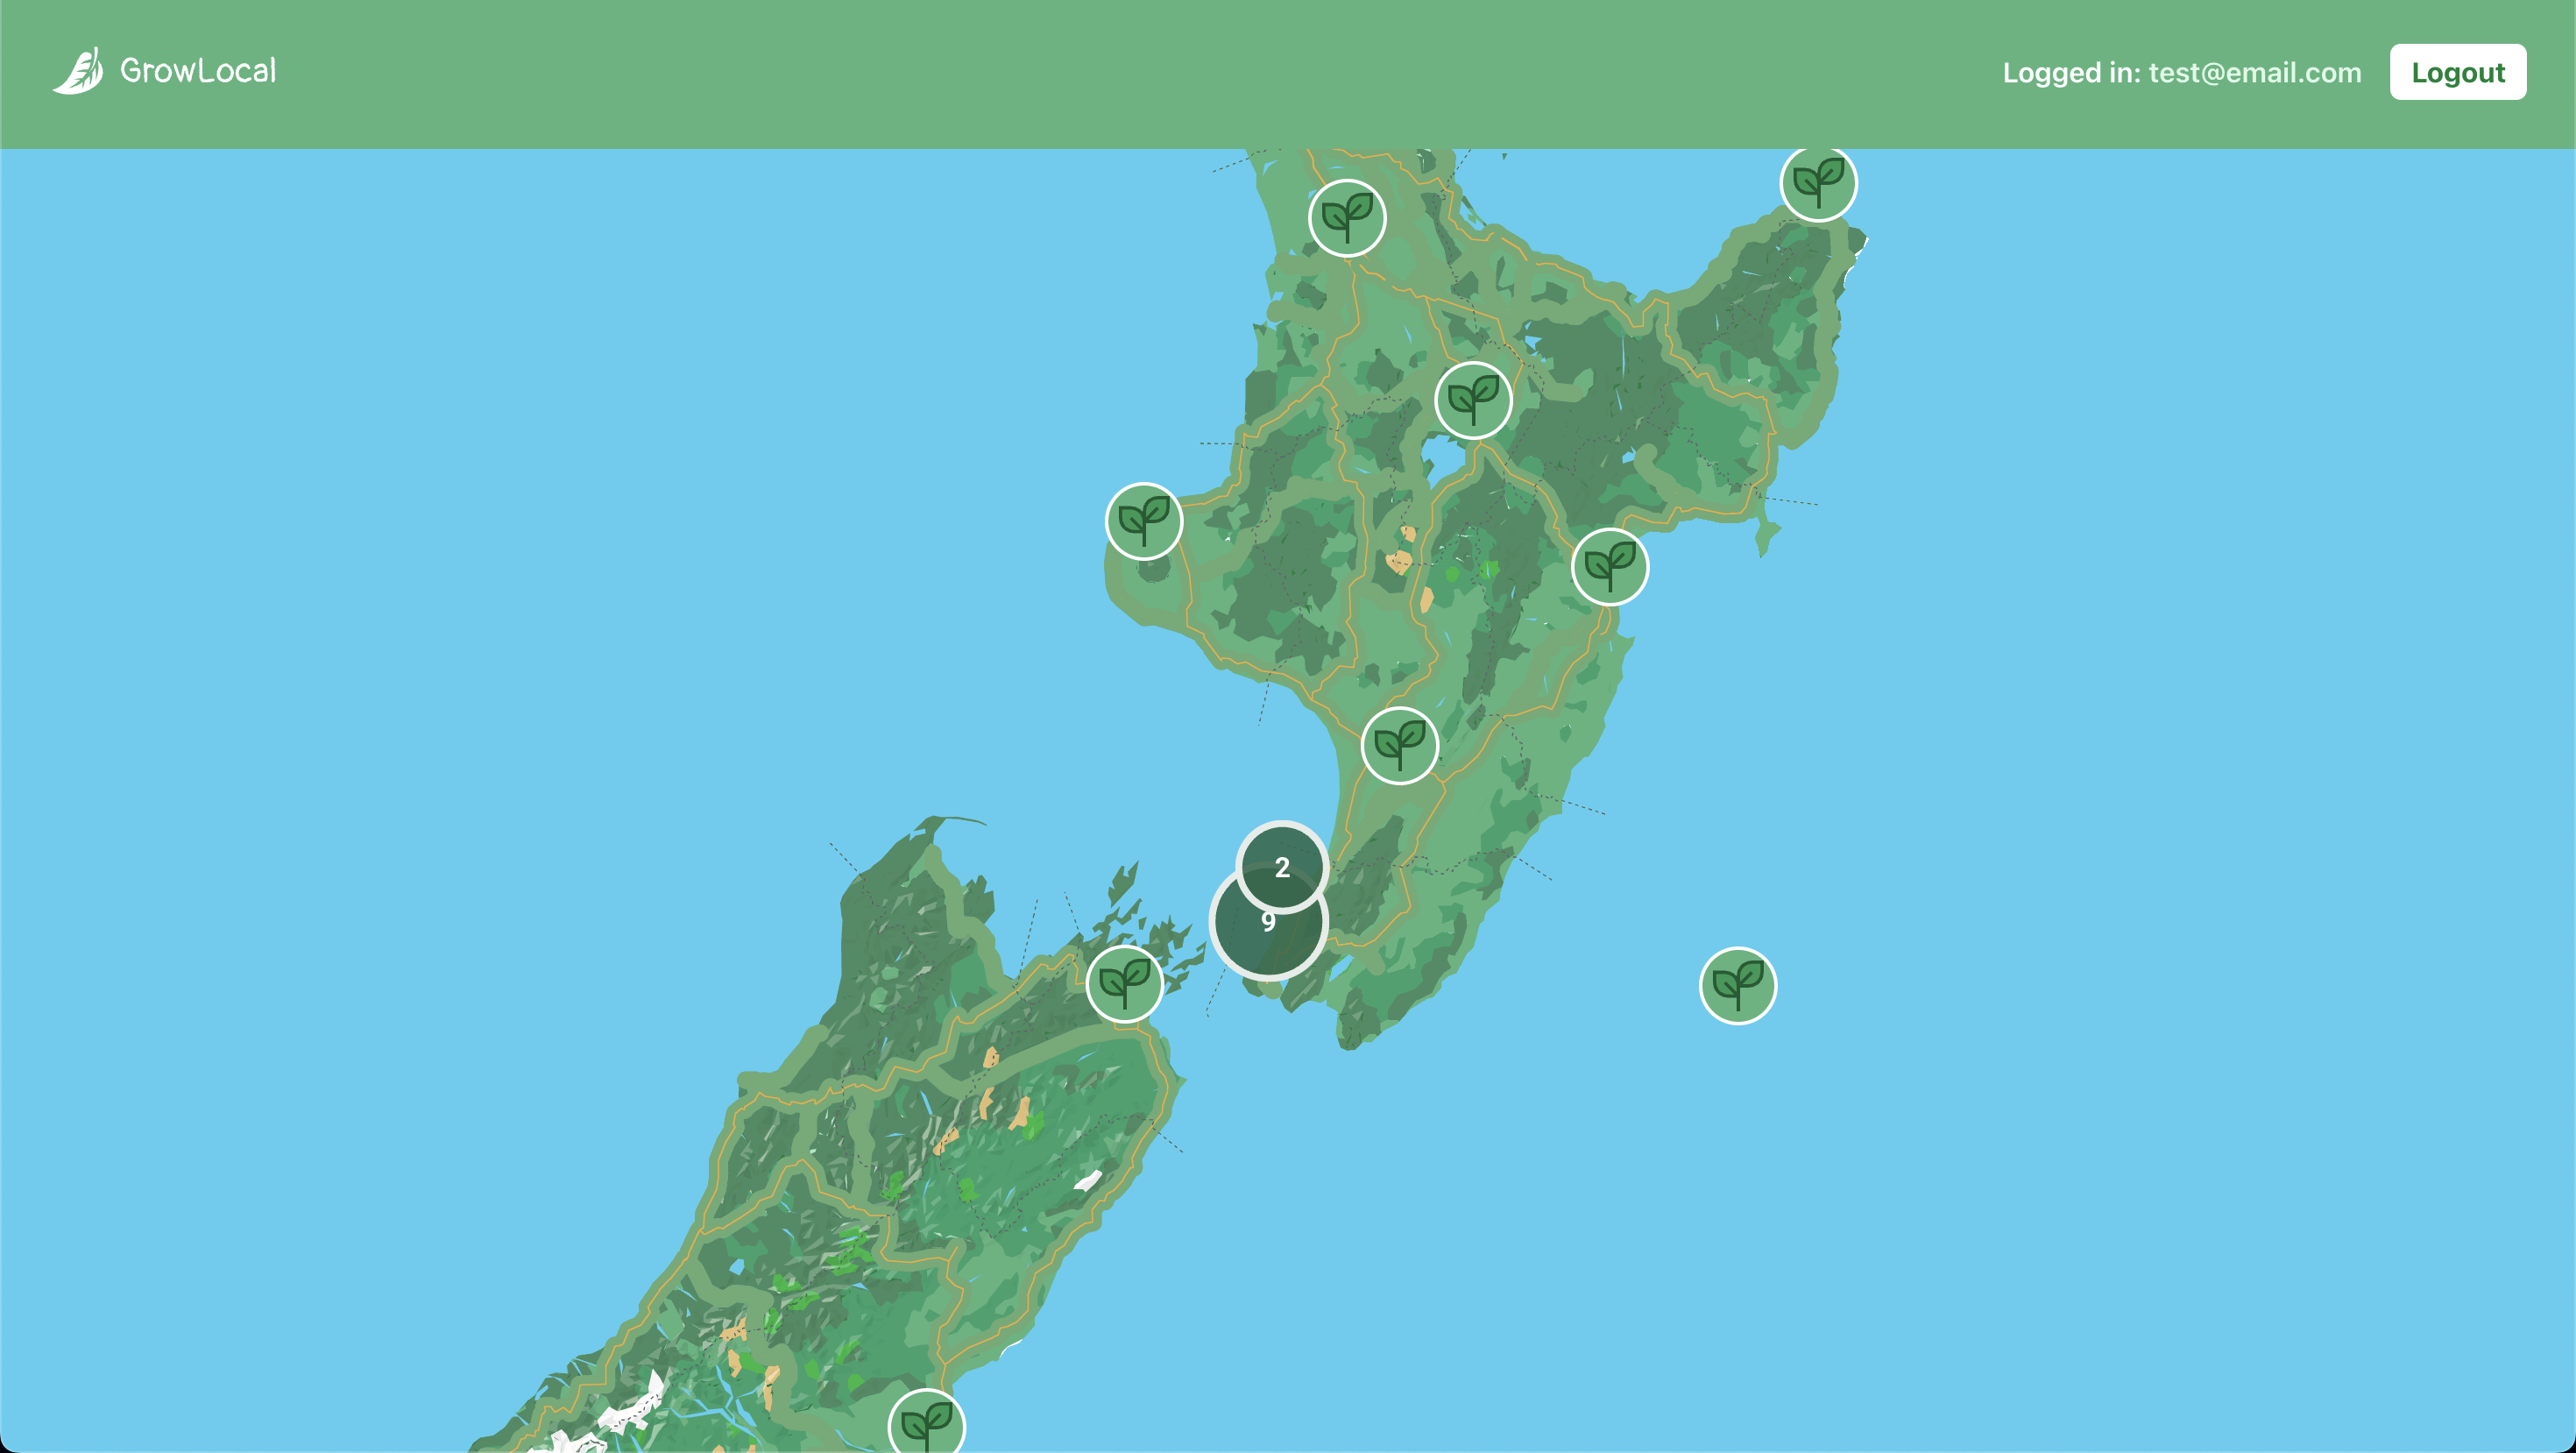
21/07/2025DOC track coordinates use NZTM (EPSG:2193), not standard lat/lng. Found a StackOverflow post about pyproj, then adapted the approach for JavaScript using Proj4. Each track now converts on the fly from NZTM to WGS84 and renders as a custom SVG marker on the map.
4. Clustering
22/07/2025With hundreds of markers on screen at once, clustering was the obvious next step. Google's MarkerClusterer had just added AdvancedMarkerElement support, so custom SVGs worked with native clustering out of the box. Built a custom renderer so the cluster circles matched the rest of the styling.
5. Wiring Up Track Data
23/07/2025Added state to track which marker was clicked, then passed that data through to a detail view as props. Also wired in Turf.js to calculate distances to nearby huts from the selected trail.
6. Polylines
24/07/2025Each DOC track includes an array of coordinates representing the actual walking path. Some come as flat arrays, some nested with multiple segments. Flattened them where needed, converted from NZTM to WGS84, and drew them as polylines when a trail is selected.
7. 3D with Google
02/08/2025Tested Google's gmp-map-3d web component. It looked great with full 3D terrain and satellite imagery, but it lives outside the React tree and doesn't support clustering or interaction events in the same way. Good for a visual demo, not practical as the main map.
8. Moving to Mapbox
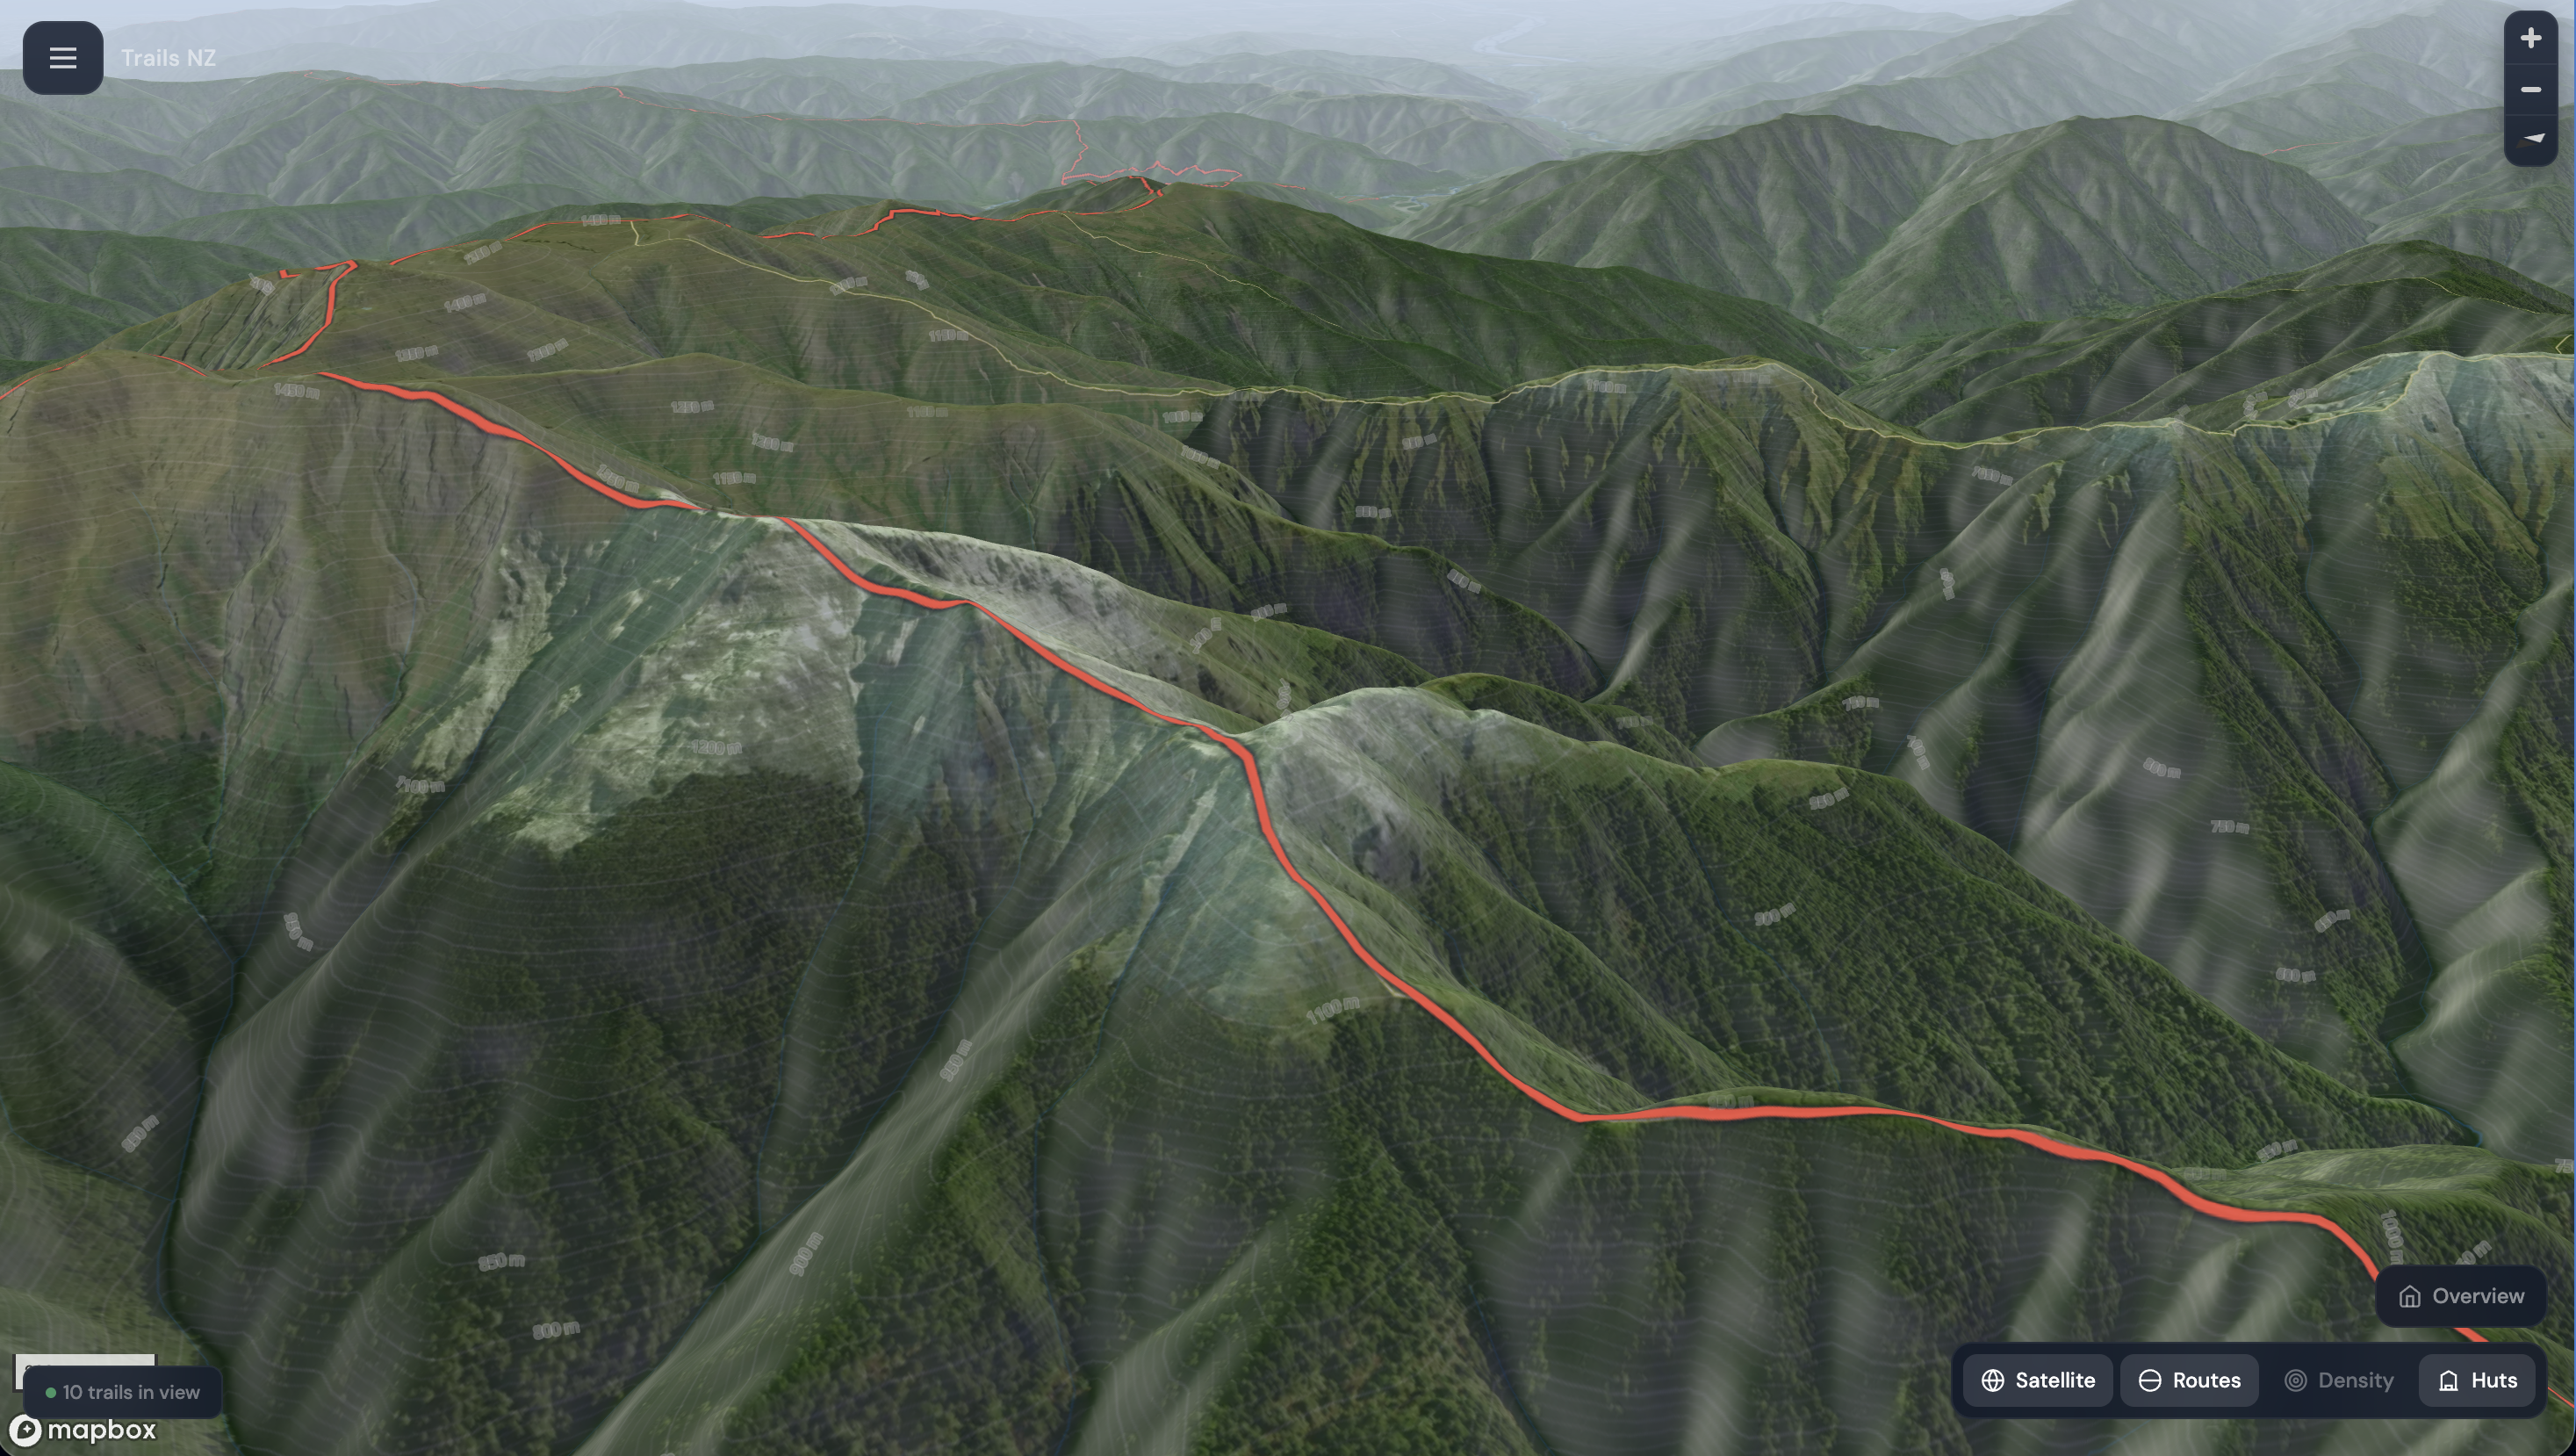
04/08/2025Switched to Mapbox GL JS. Better 3D terrain, full control over layers and styling, and everything runs through the WebGL pipeline so it scales well. Loaded the full DOC dataset as a GeoJSON source with custom icons. This is where the app lives now.
9. Atmosphere
11/08/2025Added a sky layer that shifts colour based on time of day, lighter during daylight, darker at night. Combined with Mapbox's fog API for haze on the horizon. Small touches but they make the 3D terrain feel a lot more real when the map is pitched.
10. Custom Map Styling
13/08/2025Started by overriding individual Mapbox layer paint properties after load. Eventually moved everything into a custom Mapbox Studio style instead, then layered satellite imagery at low opacity over the terrain-enabled outdoors style. Gives a hybrid look with realistic imagery but topographic detail still visible underneath.
11. Marker Rendering
15/08/2025Compared DOM-based markers (quick to set up but each one is a live DOM node, sluggish at scale) versus WebGL symbol layers from a GeoJSON source (handles thousands of points without lag, works with clustering and pitch). Went with symbol layers for the track data.
12. Wind Overlay
16/08/2025More experimental. Used Mapbox's raster-particle layer with GFS wind data to render animated particles flowing across the map. Not interactive, but it adds some movement and atmosphere to the background when zoomed out.
13. Heatmap
23/08/2025Built a density heatmap showing where trails are concentrated across the country. It fades as you zoom in, revealing individual markers and polylines underneath. Clustering keeps things interactive at mid-zoom levels, the heatmap gives the bird's-eye view. They work well together.
What's Next
Currently working on sidebar search and region filtering, map layer controls, and wiring up the trail detail panel with nearby hut distances. Check out the project page for the video demo.